von Soden's Stemma
for John 8:1-11 (1913)
Having laid the groundwork for establishing an opinion of the authenticity and nature of the Pericope de Adultera, we can proceed with a tentative reconstruction of the detailed text itself.
Von Soden
This is possible due to the intensive collating efforts of Von Soden and subsequent workers in the field. Von Soden believed that the key to establishing the difficult problem of the geneaological relationship between the majority of Byzantine (traditional) manuscripts was in unravelling the enigma of the history of the Pericope de Adultera.
Although Von Soden's plan was over-optimistic, his work is invaluable in solving the smaller puzzle of the original text of these 12 verses (John 7:53-8:11). Von Soden hand-collated most of the over 900 known manuscripts containing the verses.
Von Soden found that this huge mass of manuscripts divided itself rather straightforwardly into seven basic groups. From these groups, he constructed a basic genealogical outline or Stemma to explain the interdependance and relationship in time between the groups.
Here is Von Soden's preliminary stemma:
.gif)
Von Soden represented each group of manuscripts with a symbol μ (Greek mu) and a number, which he felt reflected their order of creation and interdependance. Thus he placed his μ1 group at the top of the Stemma (μ0 = the original, no longer available). To quote Hodges & Farstad's introduction for their own Greek NT According to the Majority Text,
"But von Soden's preference for M1 is unjustifiably influenced by his high regard for [Codex Bezae, D] (his d5) and its close allies... As usual, despite its age (5th cent.), D is an idiosyncratic text, and M1 as a whole is not very useful in constructing the original form of the story."
(pg xxiv)
In spite of von Soden's seemingly fatal assumption and approach to stemmatic reconstruction, his subsequent work remains the most accurate and exhaustive collation of the Byzantine manuscripts to date. Indeed, we shall see that quite a lot of his analysis remains as valid as ever, regarding the interesting problems surrounding the deletion and reinsertion of the Pericope. His high view of Codex Bezae had no relevance to his essential work of collation, manuscript grouping, and perceptive grasp of the phenomenae in the variants.
We will also note shortly that Hodges and Farstad were not immune to such tendencies either, that is, attaching an artificial favouritism for one group or set of readings.
von Soden's original German work can be found online. Its called:.
Die Schriften des Neuen Testaments (1913)
vol. 1: Untersuchungen, parts 1-3
Imprint: Göttingen : Vandenhoeck & Ruprecht, 1911
This was formerly online for the public at the RELTEC site, but has since been protected by a password, allowing access only by "scholars".
Since there doesn't seem to be an English translation readily available, I have been translating the work myself in another thread here:
Anyone can join in and assist, or comment on the translation there.
The 'Majority' Stemma of
Hodges & Farstad (1985)
Hodges & Farstad
The Editors of the first serious scholarly edition of the 'Majority Text', a text reconstructed on the basis of the majority readings among the some 5000 extant manuscripts and versions, offered their own stemma in the introduction to their Greek New Testament:
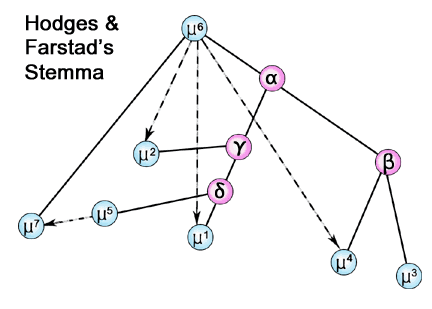
The first thing one may notice is four completely new 'entities', which do not correspond to any existing manuscripts or groups. This certainly is perhaps surprising to the non-expert, but not wholly unexpected. In fact, with the majority of *early* manuscripts missing, from which the extant manuscripts must have been copied, it is inevitable that in a modern geneaological tree some conjectural exemplars and master-copies will appear.
The real weakness in the reconstruction of Hodges and Farstad is more subtle, and will require some more detailed analysis. In summary, we can say this. Both here, and in their handling of the manuscripts for the Apocalypse, the two editors actually strayed rather far from their initial and advertised goal of reconstructing the 'Majority Text'.
Here and in Revelation, the editors have adopted some readings which are arguably *NOT* the readings of the majority of manuscripts. In these two cases, the editors were tempted by another principle entirely, the elusive prospect of doing a 'genealogical' reconstruction rather than a statistical one. In this, they abandoned their (self-imposed) mandate, and attempted a combined 'genealogical' and 'eclectic' method, apparently based upon an assessment of individual readings.
Suffice it to say, that both here, and in Revelation, we do not always get what was promised, namely the 'Majority Text', and the editors spend quite a bit of time in the introduction justifying their choice in abandoning their professed purpose, and abandoning the stemma and reconstruction of the texts in these spots as presented by the original analysts.
For instance, Hodges and Farstad abandon von Soden here in John 8:1-11, and appear to adopt Hoskier's analysis of Revelation.
A brief review of the Hodges-Farstad text can be found here:
Waltzman's brief description < - - Click here.
I will note here also, that Pickering, one of those who has ably defended the 'Majority Text' in several books and articles, was also dissappointed with the text of Revelation, and has offered his own reconstruction of it in a new appendix to his book The Identity of the NT Text, which is now online.
Pickering's book is online here:
Identity of the New Testament Text II < - - Click Here.
So we will not be alone I think, in taking the position that the attempts at reconstruction of the Pericope de Adultera have been at best preliminary so far. We will present our own fresh approach shortly.
The Genealogical Tree or 'Stemma'
Almost everyone intuitively understands that a 'manuscript tree' is like a 'family tree'. Time advances downward, and the archtypes and older members are above, with the 'descendants' below. The lines are meant to show relationships, in our case dependance, exemplars, master-copies used etc.
What is not so obvious, and yet strongly implied by typical 'Stemmatic' diagrams, is that there are more than one independant 'axis' of interest. And even when such drawings are not very accurately drawn (as is usually the case), something is usually implied in the arrangement: the 'left-to-right' order of contemporary manuscripts is often used, and also the distance between them is chosen to indicate 'closeness' of relation, or in this case the similarity of text.
Of course in the past, these additional visual cues have been rather haphazard and inconsistent, as well as more suggestive than 'scientific', and involve a lot of subjective judgement by the textual critic.
Yet a good chart can speak a thousand words, and it is in our interest to tighten up our procedures so that we are using visual cues both effectively and accurately, as well as explaining to the viewer what the intended meaning is.
The following chart indicates two very important but independant axes of interest in manuscript generation, the Time Axis, and the Generational (Copy) Axis:
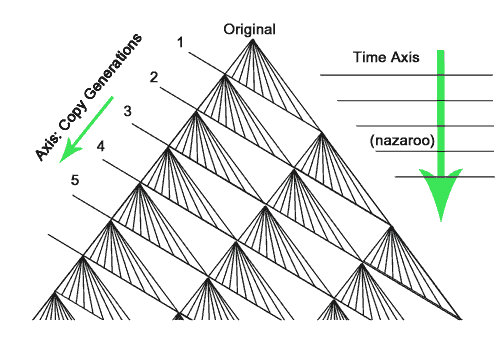
Notice that the chart appears neat, because all the manuscripts are shown, and the copies are arranged from first to last for each exemplar or master copy. This neatness is in part a function of simply organizing our data (and the location of the manuscripts) in a way that conveys the generational information clearly and easily. A 'real' chart would have missing points (mss) and connections which sometimes crossed over one another. Also, a pure genealogical tree like this does not visually indicate 'mixing' or cross-corrections, a common occurance.
On a chart like this, all manuscripts located at the same 'height' are the same age, whereas all manuscripts in the same 'copy generation zone' would be the same generation, (two entirely different things!). For instance, the mss at the bottom right would be a very recent copy, but only 3rd generation, while one the same age on the left would be 8th generation!.
Of course charts, like statistics, can be distorted or manipulated to exaggerate or give misleading impressions. In the two first stemma presented by von Soden and Hodges/Farstad, the horizontal dimension is intentionally used to convey a sense of the relation of the manuscripts through their distance.
Groups closer together are alleged to be more closely related, and groups which are central are supposed to be nearer the core of the main lines of transmission.
But in both of these previous stemmatic charts, the distances on the chart are inaccurate and overly suggestive of the assumptions and assertions of their authors.
We are going to work with similar stemmatic charts, and follow similar conventions in our own use of the horizontal dimension. Nonetheless, we are going to try to be less 'suggestive' and more pragmatic and careful in our use of 'distance'. The result will be a more accurate and ultimately more useful chart, which will visually reflect a truer picture of the actual state of the relations between the manuscript groups.
Preliminary Look
at the MSS Groups
The first thing we want to do is have a look at von Soden's manuscript groups. To form a group, a set of manuscripts must either share unique readings or else share a set of common readings in a unique pattern.
Preliminary Apparatus: Colwell Diagrams
In order to lay out more clearly the state of the variants, it was necessary to diagram a 'text-line'. By this we draw a line which follows the text, and makes clear where the various manuscripts and readings depart from the typical text. Like a river, splitting up and then rejoining, the various groups lead away, then back again to undisputed portions of the Pericope.
Here is a sample page of the preliminary apparatus assembled for this analysis. For it we based the text upon the majority text, and relied heavily upon von Soden's critical apparatus and updates and corrections from Hodges/Farstad. Finally, we consulted both Nestle, and the UBS texts for additional notes and to flesh out the manuscripts represented by von Soden's groups, as well as Merck.
No doubt the apparatus remains incomplete, and contains some minor errors and ambiguities. However, it is important to realise that the basic text, groups and variants will not substantially change even when errors in collation are corrected and new manuscripts are added. The apparatuses we have, suitably combined, will represent the substantial situation with the text. It may be that some countings of manuscripts for various groups may also change, e.g., instead of 280 mss for M5 there may now be 300 or more. But these 'clean up' tasks should not affect the main picture a whole lot.
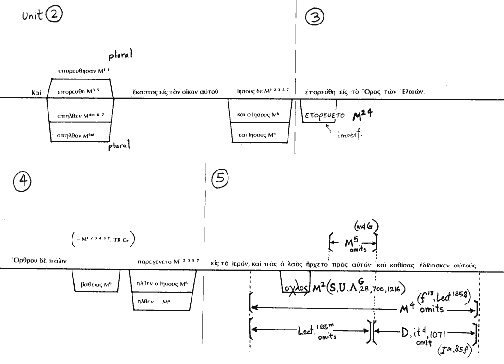
You can view the Colwell Diagrams for our preliminary apparatus here:
Preliminary Apparatus for John 8:1-11
It is important to note that these variants don't represent individual manuscripts, but (usually large) groups of manuscripts. They are already 'averages' of the texts and idiosyncrasies of individual mss are largely ignored.
The individual 'micro-variants' were further collected and labelled by their relation to other nearby and obviously related variations. From this preliminary organization of the data into 'variation units' , we were able to identify about 38 individual and independant units . Although textual critics may haggle over the details of what exactly will qualify as a 'unit', the substantial picture will remain at about 35-40 variation units.
Agreement in Error
This requirement is based upon a fundamental principal called 'Agreement in Error'. This is a statistical law with a logical base:
If most manuscripts have a common reading but two manuscripts share a peculiar variation, this is an agreement in 'error'. In this context, 'error' doesn't necessarily mean the variant was an accidental alteration or a mistake. In fact, the change could be a deliberate improvement in spelling or a clarification of an ambiguous wording.
What matters is not the cause or quality of the difference but the fact that two scribes, distanced by time and place, are unlikely to have independantly made identical changes to the text. The depth of uniqueness is the measure of the likelyhood of a common origin or that one scribe copied the other.
Agreement in Error is an essential method or assumption about minority readings for the purpose of establishing genealogical relationships. What is remarkable is that the premise upon which it is based is the same as that upon which the argument for the Majority Text as a whole is based.
It is not assumed that 'coincidences' never happen, but that the probabilities increase dramatically that a group of minority readings is false when the mss count for the each of the individual readings get smaller. It is not an empirical claim about every and all majority readings, but a statistical claim about how independant probabilities combine to ensure a stable result overall.
We use the same statistical reasoning in court cases and in analyzing cheaters in school exams. It is to be expected that most exam papers will have a large number of correct answers in common. This is no indication of cheating (copying).
But when a very small number of papers all from the same area in a known seating arrangement have the same wrong answers, and these wrong answers are not 'common' mistakes, but rather new and peculiar answers, we know that someone copied someone.
The statistical power of this methodology is so strong, that we don't even need to know the correct answers to the exam beforehand. We can actually establish a body of probable right answers and rank them by popularity. In complimentary fashion, we could define a group of probably wrong answers, from which possible candidates as evidence of cheating could be culled.
Agreement in Error for von Soden's Groups
We will tabulate the unique readings of von Soden's groups below.
M1 (3mss) - 9+ readings: (too many variants to list, due to Codex Bezae)
M2 (40mss) - 4 readings: οχλος, ειπον εκ, ανεκυψεν, [om.κατω]
M3 (30mss) - 1 reading: αναβλεψας
M4 (30mss) - 6 readings: και ΙΣ, [ι], και...προσηνεγκαν, επ, αυτω...το φωρω, [και εχηλθον],[και]
M5 (280mss) - 6 readings :[προς αυτον], εν, καταληφθεισαν, πειραζοντες, κατεληφθη, κρινω
M6 (250mss) - 4 readings: και ο ΙΣ, βαθευς, ο ΙΣ, (+ενος...αμαρ.), (W.O.R.),
M7 (260mss) - 1 readings: (W.O.R.)
From the above we see that M2, M4, M5, & M6 are easily distinguished as groups or families, while M3 and M7 barely make it. Their unique readings may even be further reduced by fresh collations.
Thus von Soden is essentially right in his grouping, the finest divisions that we can convincingly sort the manuscripts into.
Later we will further legitimize some new sub-groups based upon von Soden's own data (i.e, M6a and M6b), and identify others as secondary from other evidence. For the moment we may note that Pickering also often treats M1, M2, M3, M4 as a single larger 'group' ("h"), mainly because of the lack of manuscript support and the lack of evidence of uniqueness.
The next collection of readings considered will be those shared by more than one group. It is these variants which will help us determine closeness of the different groups and the relationships between them.
Next Circle Outward...
Readings shared by Group Pairs
The unique readings establish the core groups.
Now we move one level outward to establish the relationships between the groups. For this we begin with readings that are shared between *TWO* and only *TWO* groups of manuscripts:
This next level is the most significant level, because it is from here that we can place our groups on a chart in a way that illustrates their relative closeness easily.
Affinity
Just as with previous 'stemma', we want distance between groups to represent something, namely the 'affinity' between the groups. Groups close together will have the most similar and closely related texts, and those far apart will have relatively little direct relationship.
However, the concept of 'affinity' is not at all the same as the concept of 'dependance', and we must make this distinction clear. The mere sharing of a reading or closeness of two texts tells us nothing by itself about the actual direction of the dependance if there is any, or whether both texts are dependant upon a third source.
This is the same as the case of the 'two pupils in the exam'. Cheating maybe evident, but who copied who must be determined by other outside factors, like the previous record and ability of the two students!
In our case, we can draw an apt parallel from the theory of Special Relativity. In the system of Minkowski Space which is used to represent spacetime (a blend of space and time), true 'simultaneaousness' is in merely in the eye of the beholder, and dependant upon that observer's own position and acceleration.
What remains 'constant' in spacetime is not 'space' or 'time', but the absolute distance between two points in a spacetime diagram. This is based upon a modified version of the Pythagorean Theorem, the method for calculating distances along the hypoteneuse of an arbitrary triangle.
In a similar way, the 'Affinity' between two manuscript groups will remain constant, regardless of how we orient the group on a TIME axis. The relative shape and distances of the cluster of manuscripts stays constant, although we may try reversing or altering the dependancies of various groups in the cluster by rotating the whole diagram in two or three-dimensional 'diagram space'. (By convention, we keep 'time' advancing straight downward in the diagram, and dates are represented by horizontal lines across the chart.)
Lets imagine how this works: By convention, some basic 'distance' is chosen to represent a given closeness of text between two groups, based perhaps upon a headcount of fundamental 'variation units', or a similar scale. Thus in equation form, we might make Distance = 1/(# of shared readings). This will work nicely for simple clusters of mss groups, and often can be adequately represented in two dimensions. (Larger numbers of groups and their complex relations might require 3 or more dimensions to adequately display relations. More than 3 dimensions would require quite abstract methods of projecting the data, and the utility of 'diagrams' becomes limited.
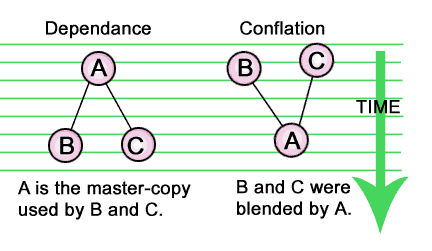
Here's an example: Either B and C copied A, or A blended together B and C to produce a new text. Nothing about the 'affinity' tells us which. The affinity, or relative distance between the groups is constant. Only their orientation on the Time Axis changes, as we try different possibilities.
Paired Reading List between Groups
Readings shared by two and only two groups:
m1-m2 :επορευθησαν, (7:53), κατεγραφεν (8:6), [και...γυν.] (8:10)
m1-m5 : κατηγορειν (8:6)
m1-m6 : ο ΙΣ μονος (8:9) W.O.R. partial reading
m2-m3 : σχωσι (8:6) spelling
m2-m4 : επορευετο (8:1)
m2-m5 : [αυτη] (8:11)
m2-m6 : επερωτωντες (8:7)
m3-m4 : [μονος] (8:9), +αυτη (8:11)
m3-m5 : επορευθη (7:53)
m3-m6 : sub - γυναι (8:10)
m4-m5 : [απο του νυν] (8:11)
m4-m6 : και (8:1), ηλθεν (8:2), αναβλεψας (8:7)
m5-m6 : +ενος...αμαρτιας (8:8) partial reading
m5-m7 : ανακυψας (8:7), προς αυτους (8:7), εκεινοι (8:10)
m6-m7 : ταυτην αυρομεν (8:4), μοιχευομενη (8:4)
...and now we tabulate the agreement-count between groups in a table.
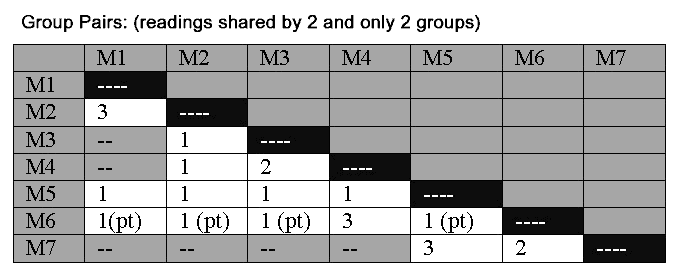
Three common readings between a pair of groups is the highest affinity. The groups pair off strongly:
M1-M2 (50 mss), M4-M6 (280 mss), and M5-M7 (340 mss), with M3 on its own.
As we suspected when looking at unique readings, M7 seems only to be a branch of M5, and M3 a weaker branch of M4-M6.
The count of shared readings can be diagrammed on an affinity chart. On this chart, the relative placement of the 'Super-Groups' reflects both their closeness to each other through shared readings, and also what groups should be at the core, and what groups are peripheral to the cluster:
"Super-Groups:"
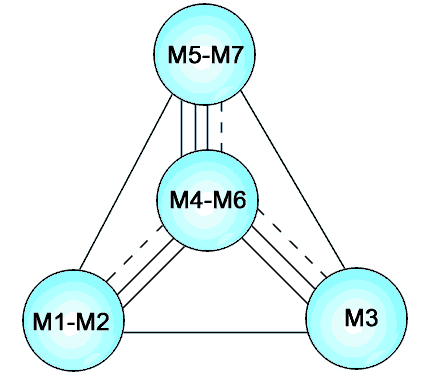
Note that any external 'node' could be the 'archtype' or source of the others. In fact, the cluster can be oriented to imply mixture as well, suggesting more than one source. Finally, note that regardless of scales, or orientation, only one 'Super-group' can be centrally placed, M4-M6.
This means that placing other groups in that position ignores the true affinity relationships between the groups and super-groups.
This was one of the faults we found both with von Soden's original Stemma, and also Hodges & Farstad's new proposal. Neither stemma adequately arranged the groups by their affinity, and neither stemma correctly identified the transmission 'core'.
It should also be noted that this is by no means a finalized 'stemma', even in shape. It only represents one layer of critical information, albeit a very important layer. We are nowhere near finished reconstructing the stemma or the text.
The centrality or core position of M4-M6 doesn't mean that it cannot represent the source or archetype. To see how that could be, imagine viewing the cluster on edge. Then suppose we raise M4-M6 slightly, making it earlier in time than the others. The cluster now takes on a 3-dimensional shape, actually a tetrahedron. M4-M6 does not lose its centrality or core position by becoming the head of the stemma in a two-dimensional projection of a 3-dimensional stemma.
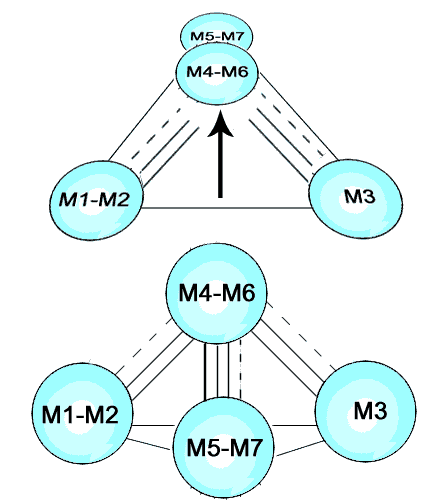
This chart is remarkably similar to von Soden's original stemma turned on its side. It shows that von Soden more or less correctly arranged the groups by affinity (no real surprise, since he collated them carefully), but had his own views of dependancy based upon other factors.
Triplet Readings:
shared by 3 and only 3 groups
Here we can start to evaluate the temporal (genealogical) relationship between groups. For when we find a group sharing the reading of a Super-Group it is likely the group was swayed by the prevalent Super-Group and not vise versa.
M5-M7 has the appearance of greatest influence, (and hence is the older text):
M5-M7 sways M1 three times:
λιθοβολεισθαι (8:5), ανακυψας (8:7), [περι αυτην] (8:5)
M5-M7 sways M2 once:
μονος ο ΙΣ (8:9)
M5-M7 sways M6 once:
εκεινοι (8:10)
M4-M6 sways M7 once:
απηλθεν (ον) (7:53)
M4-M6 sways M3 twice:
+τω/ειπον (8:3-4), ειδεν αυτην και (8:10)
M1-M2 sways M3 once:
[και υπο...ελεγκομενοι] (8:9)
M1-M2 sways M5 (possibly) once:
Μωσης ημιν (8:5)
Other triplet Groupings do not support the influence of a Super-group, but do demonstrate the antiquity of the readings (i.e., the lateness of the groups themselves).
M1-M6-M7: + αυτη (8:11)
M3-M6-M7: ημων Μωσης (8:5)
M1-M3-M4: [εκεινοι] (8:10)
M2-M3-M4: [κατ-] (8:4), [μη προσποιουμενος] (8:6), + γυναι (8:10)
M5-M7 shows the greatest influence upon the groups and appears the oldest. (this also coincides with its numerical predominance at about 540 mss.).
M4-M6 comes in second, and appears older than the M7 branch of M5-M7 (we will see astounding evidence of this later).
M1-M2 also seems ancient (older than M3), but it is not likely older than M5. Seeing as M5-M7 was able to influence both M1 and M2, it is more likely that M5 has at Jn 8:5 influenced both M1 and M2, and the apparently 'late' M7 has here simply lost the original reading.
Putting the new relations into an Affinity chart gives:
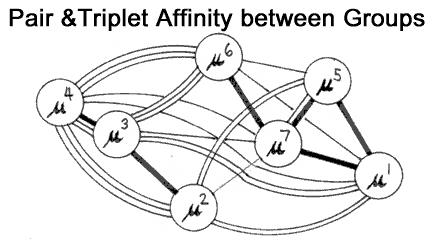
Thin lines represent a single shared reading, and thick solid black lines represent four readings. Distances for the most part display closeness in terms of triplet readings. (2-dimensional projection).
Unexpected confirmation of the fact that M3 is really a branch of M4-M6 comes from six new readings that they share, giving a total of eight (+ 1 partial). This does not mean that the original grouping, M4-M6 is incorrect however, for we must now add 3 new readings between them also, giving six.
In light of this we expand our Supergroup to include M3, and give M6 a less important role. This makes sense considering that M6 is a comparatively late branch of M4, as is M3. Notice the strong mixture suggested in M3, which M6 has escaped. Just as M3 has been influenced by M1 and M2 (?), so M6 has absorbed readings from M7 (or vise versa).
Here we also find more support for M5-M7: we can add five more shared readings, giving a total of eight. (these are very high numbers of shared readings given seven groups and only 12 verses!).
Preliminary Stemmas
From the Super-Group evidence in the triplet readings we can begin to sort out the more ambiguous relations between groups.
Knowing that M4-M6 has swayed M7 and M3, we can assume that
ημων Μωσης
(8:5) and probably also +
αυτη
(8:11) are copied from M6 by the others. For the last two groupings, M3 apparently did not originate the readings, but borrowed them from M4, as must have M1 and M2.
Thus as a rule, M3 borrows from M4, and M7 borrows from M6. Seeing as M2 has little affinity to M5 as regards both pairs and triplet readings, whereas M1 has much more affinity to M5 when triplets are included, we can assume that the M5 reading,
Μωσης ημιν
(8:5) was borrowed by M2 from M1. (see dotted line through M1 on triplet affinity chart).
In summary then, two family trees emerge:
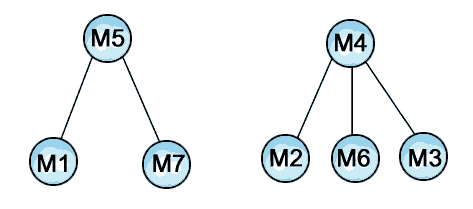
As Hort admitted, and Colwell restated, the Genealogical method must stop when we arrive at two branches. At this point we must appeal to internal or other evidence.
If we were to consider Quadruplet readings (shared between four or more groups), we would simply have 'majority' readings,
and would no longer be using 'Agreement in Error' technique, and could not rely upon the statistical probabilities of that method. This would simply be the 'negative' of the image of the data we have been looking at.
It is interesting to note that the 'Agreement in Error' technique of the genealogical methodology has led us to potentially identifying M5 as a good candidate for at least one archtype at the head of two possible branches of transmission. M5 has the largest attestation (280+ mss), and taken with M7 this branch constitutes an overwhelming 540+ manuscripts, versus the paltry 300 for all other groups combined.
Combined Genealogical and Affinity Chart:
(thick lines represent THREE shared readings, and thin lines one reading. Dotted lines represent partial readings.)
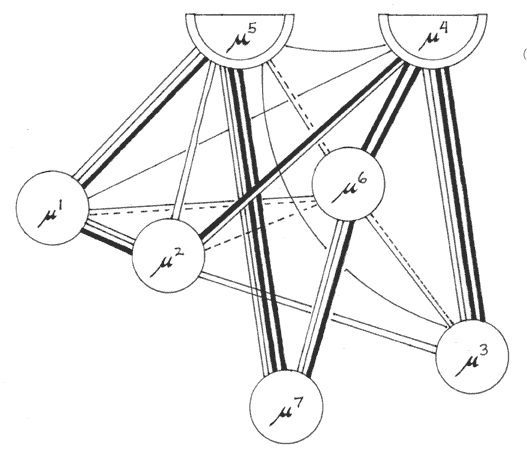
Again we stress that these are nothing like final 'stemmas'.
We have not reached any stabilized overview yet. However we have after all, only applied one simple tool, the 'Agreement in Error' technique, and accumulated important data and a rich picture of the relations between groups.
Yet we are hardly out of good solid techniques and associated information to apply to the task. Shortly we will try a few other powerful tricks and discover even more amazing facts about the textual stream of transmission for the Pericope de Adultera.
...


